Basic Forex Trading Strategies and Indicators
Date Modified: 06/08/2023
The Forex market’s diversity and magnitude allow traders the opportunity to create strategies based on movements in the market. When trading Forex, there are a number of trading strategies and indicators to choose from. Each strategy can be customized or tailored to the individual needs of a trader and used in conjunction with other strategies.
When considering which trading strategy is best for you, you need to take into account your personal goals, risk appetite, experience and trading preferences. Before exploring the different trading strategies, we will first outline two key trading methodologies: fundamental and technical analysis.
Fundamental Analysis vs. Technical Analysis
Traders generally sit in one of two categories: fundamental or technical.
1. Fundamental traders will look deeper for wider economic, political, social, and global variables to determine whether or not a currency pair will appreciate or depreciate and to weigh a currency’s value. When implementing a Fundamental Analysis in Forex trading, traders might base their decisions on the following components:
Geopolitics: changes in political policies, tensions between countries, and new treaties or differences can affect the market. Hence, being aware of the geopolitical status can aid traders in their fundamental approach.
Central Banks: central banks like the Federal Reserve can affect monetary policy through decisions like interest rates, which can affect currency pairs’ value.
Economic Releases: to take a basic example, if an economic report came out that was particularly strong, then it might indicate a currency could appreciate relative to another currency. However, if all traders expected the economic report to be strong (prior to the report being released), the impact of the report would already be ‘priced in’ to the market.
2. Technical analysis utilizes chart indicators and past price directions and movement patterns in order to determine whether a currency pair, such as the Euro to US Dollar (EUR/USD), is overbought or oversold. By relying on statistical trends or patterns, like volume and price movement (appreciation/depreciation), traders seek to predict which way a currency pair may swing.
There are many types of charts available for Technical Analysis, Plus500 offers Line charts, Bar charts, and Candlestick charts on its trading platform.
Of course, there is no one correct chart to use. Thus, traders can utilize a blend of technical and fundamental analysis to evaluate potential investment opportunities.

Illustrative prices.
Approaches and Indicators to Use When Trading Forex:
In addition to the above trading methodologies, below is an outline of a number of approaches and indicators that can be used when trading Forex.
Position Trading - Position trading is a strategy where traders hold positions for longer periods of time, usually weeks or months. Position traders will generally utilize fundamental analysis and economic data. However, when opening a new position, position traders might make use of technical analysis. Furthermore, a position trader may wait until a currency pair reaches a (predetermined) support level before taking a long position and holding it for a few weeks. This type of trading is presumably less immediate, as traders are not necessarily concerned with intraday prices and generally open fewer positions (when compared to other trading strategies). Nevertheless, as is the case with any kind of trading, traders need to have a firm grasp of market fundamentals and position trading largely relies on fundamental analysis.
Position trading can leverage market trends, recurrent styles, and past movements in order to predict and make trading moves. Hence, position traders are often referred to as 'trend followers'.Simple Moving Average (SMA) - Simple Moving Average (SMA) is an important technical indicator and one of the most frequently used trading indicators. SMA is used to determine if an asset price will move up or down, and is beneficial in that it reflects an asset’s volatility in the direction it heads towards. Hence, if the SMA is pointing upwards that means that the asset’s price is increasing, whereas if it points down, the price of the asset is decreasing. Therefore, trend-followers or position traders often refer to SMA when trading as they attempt to buy assets that are moving up and sell those that are declining. Moreover, SMA is calculated by taking the closing daily price of an asset and dividing it over the total days to get an average. The line that is created by the SMA is then used, along with other technical indicators, to gauge price movements. An SMA line can be of any duration, however, technical traders tend to follow the 50, 100 and 200 day moving averages. You can test different strategies utilizing our charting system.
Exponential Moving Average (EMA) - In comparison to the Simple Moving Average, an exponential moving average gives more importance to recent closing prices and traders’ recent market activities, hence providing a more detailed and time-sensitive image of the market. In addition, when compared to the Simple Moving Average, the Exponential Moving Average’s reaction to price fluctuations is more observable than the former. This makes results from EMAs more efficient and is one of the reasons why they are the preferred average among many traders. When using Exponential Moving Average lines, it is important to take into consideration that they are lagging indicators that may not respond quickly to sharp changes. Short-term trading periods might not have enough price indicators to be reliable. However, they do give a clear visual picture of overall trends and can be very useful in currency trading.
Relative Strength Index (RSI) - Relative Strength Index can be used in tandem with the SMA line for additional clarification on the possible trend of an instrument. RSI demonstrates whether an asset is overbought or oversold, based on an index of 0 - 100. Traders can refer to the RSI to determine market trends. Using this chart traders can determine if there’s an upwards trend that’s forming or a downwards one. Generally, a good indicator is if the RSI is above 50 then that’s usually an uptrend, whereas if it’s below 50, then it’s safe to say that it’s a downtrend. However, you must remember, this is just a general indicator and you will often need to tailor your forex trading strategies depending on the asset in question.
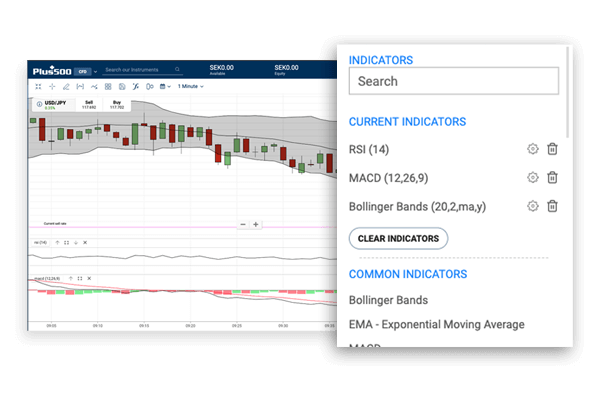
Bollinger Bands - Bollinger Bands are often used with SMA lines as one of many trading strategies. Bollinger Bands include upper, lower, and middle lines and each of this indicator’s lines. But Bollinger Bands are inseparable from the SMA line. They are created by calculating the standard deviation from a given SMA line. Standard deviation is simply a measure of volatility. When the bands widen, this is an indication that the market has become more volatile. When they contract, the market has become more stable. A Bollinger Band will have an upper and lower threshold above and below the SMA line. The SMA line is sometimes referred to as the ‘middle’ Bollinger Band.
Moving average convergence divergence (MACD) - MACD is designed to measure the momentum of a currency pair and it is done through the calculation of the difference between two separate time periods either on short-term or long-term periods, hence, the divergence. It is also one of the most referred to metrics and it’s used to both identify an upward or downward trend and also measure the strength of the trend.

Illustrative prices.
These are just a few of many different forex trading strategies and indicators that traders adopt to help enhance their trading success, there are numerous combinations of FX trading strategies and no limit to the number of technical indicators that you can use.
If you want to learn more advanced trading strategies, then consider our CFD trading platform, featuring more than 90 technical indicators, advanced drawing tools and in-depth analytical tools which will help you learn the nuances of Forex CFD trading. You can also practice your skills in our risk-free, unlimited demo account.
To try our indicators, simply sign up/log in, select an instrument, go to its chart and click on the (Fx) icon.
*This article contains general information which doesn't take into account your personal circumstances.
Related News & Market Insights
Get more from Plus500
Expand your knowledge
Learn insights through informative videos, webinars, articles, and guides with our comprehensive Trading Academy.
Explore our +Insights
Discover what’s trending in and outside of Plus500.
Stay up-to-date
Never miss a beat with the latest News & Markets Insights on major market events.


